Overview
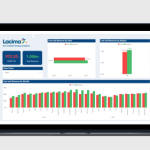
Lacima Analytics is a comprehensive enterprise-grade risk analytics platform built for energy trading and commodities management environments. Designed to support complex financial modeling and large-scale market analysis, the platform enables organizations to evaluate trading exposure, monitor risk positions, and generate interactive business intelligence dashboards from a centralized system.
The solution combines advanced mathematical modeling with real-time analytics and visualization tools, helping trading firms make faster, data-driven risk management decisions.
The Challenge
Energy and commodities markets operate in highly volatile environments where risk exposure changes continuously. Traditional analytics workflows often struggle with:
- Complex risk calculations across multiple portfolios
- Limited visibility into trading exposure
- Slow reporting and fragmented data systems
- Difficulty visualizing large-scale financial data
- Manual analysis processes prone to operational inefficiencies
- Lack of centralized risk management infrastructure
For trading organizations handling large volumes of financial and market data, accurate modeling and fast analytical access are critical.
The challenge was to build a scalable analytics system capable of processing advanced risk calculations while providing intuitive data visualization for decision-makers.
Our Approach
We developed a high-performance enterprise analytics platform focused on advanced financial modeling, reporting automation, and interactive visualization.
The platform architecture was built using:
- .NET Framework for enterprise-grade application infrastructure
- WinForms for stable desktop-based operational interfaces
- DevExpress for advanced enterprise UI components and reporting tools
- Power BI Embedded for interactive dashboards and visualization systems
- Advanced mathematical modeling engines for VaR (Value at Risk) and PFE (Potential Future Exposure) calculations
The solution was engineered to support high-volume analytical operations while maintaining usability for risk analysts and trading teams.
Key Features
Advanced Risk Modeling
Perform sophisticated financial calculations including VaR, PFE, and commodities exposure analysis.
Interactive Power BI Dashboards
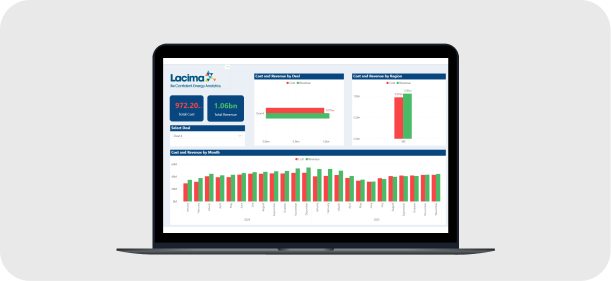
Embedded Power BI visualization enables real-time monitoring of portfolios, market trends, and risk metrics.
Centralized Risk Analytics
Unified platform for managing trading exposure, analytics workflows, and operational reporting.
Enterprise Data Visualization
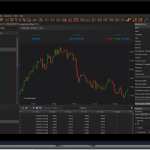
Transform large-scale financial datasets into structured and actionable visual insights.
Automated Reporting Systems
Generate operational and analytical reports with reduced manual effort.
High-Performance Data Processing
Optimized for handling complex financial calculations and enterprise-level analytical workloads.
Technical Architecture
Application Layer
- .NET
- WinForms
- Enterprise Desktop Infrastructure
UI & Reporting Systems
- DevExpress Components
- Reporting & Grid Systems
- Financial Data Visualization
Analytics & Modeling
- VaR Modeling
- PFE Calculations
- Advanced Mathematical Engines
Visualization Infrastructure
- Power BI Embedded
- Interactive Dashboards
- Real-Time Data Presentation
Results & Impact
Improved Risk Visibility
Trading teams gained centralized visibility into portfolio exposure and market risk positions.
Faster Analytical Decision-Making
Interactive dashboards reduced the time required to interpret complex financial data.
Reduced Operational Complexity
Automated reporting and analytics workflows improved efficiency across teams.
Enterprise-Scale Performance
The platform handled large analytical workloads while maintaining stable operational performance.
What Makes Lacima Analytics Different
Lacima Analytics is built specifically for high-complexity energy and commodities environments where advanced financial modeling and data interpretation are essential. Unlike generic BI platforms, the system combines deep analytical capabilities with enterprise visualization infrastructure tailored for trading operations.
By integrating advanced mathematical engines with interactive Power BI dashboards, the platform provides both analytical depth and executive-level visibility within a single ecosystem.
Technologies Used
- .NET
- WinForms
- DevExpress
- Power BI Embedded
- VaR Modeling
- PFE Analytics
- Enterprise Risk Systems
- Financial Data Visualization
Building intelligent analytics platforms for high-performance industries.
Need a custom analytics system, enterprise dashboard, or financial risk platform? Let’s build it together.